Hammer Tracking Tool with Volume Dashboard
Hammer Retest with Volume
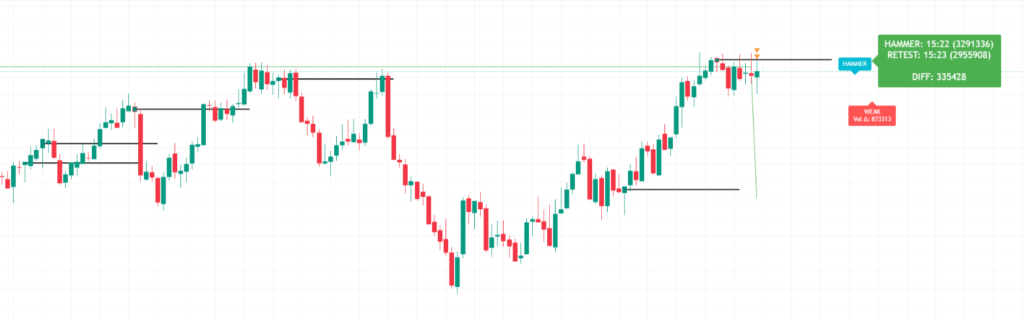
A two-phase detection indicator: identifies hammer candles and then monitors for a price retest of the key level — rating each retest as Strong or Weak using volume confluence.
The dashboard appears in the top-right of your chart and updates on every bar. It gives you an at-a-glance comparison of the hammer and retest volumes without having to hover over individual candles.
Green background means the volume difference is positive — the retest was quieter than the hammer, indicating waning selling pressure. This is bullish context.
Red background means the retest had equal or greater volume — sellers are still active. Be conservative with position size.
| Setting | Default | What it does |
|---|---|---|
| Hammer level type | Mid | Where the horizontal level is drawn. Mid = (open + close) / 2. Close = closing price. Low = candle low. Mid is the most commonly used for retest entries. |
| Enable HTF confirmation | On | Requires the selected higher timeframe to also show a hammer pattern. Significantly improves signal quality — recommended to leave enabled. |
| Higher timeframe | 15 | The HTF to confirm against. On a 1m or 3m chart, 15m works well. On a 5m chart, try 30m or 1H for cleaner confirmation. |
| Max labels | 3 | Number of past hammer/retest labels kept visible on the chart. Raise to study history; lower to keep the chart clean during live trading. |
| Label distance | 100 | How many bars to the right the label is offset from the candle. Increase if labels are overlapping with recent price action. |
| Show dashboard | On | Toggles the volume summary box in the top-right corner. Disable when screensharing or if you find it distracts from your chart layout. |
How to Use ?
The indicator has a two-phase logic — first it finds a hammer candle (long lower wick ≥ 2× body, tiny upper wick), then it watches for price to return and “retest” that level. The retest label tells you whether the setup is worth trading.
The trade in plain :
- Hammer forms → teal candle + yellow level line appear
- Price pulls back to that level on a later candle → retest label fires
- If it’s STRONG (first touch + near PDL + lower retest volume) → higher-probability long setup
- Stop loss goes below the hammer’s low; if price closes below it, the setup is cancelled automatically
The Vol Δ number in the label is the most important filter — a large positive value means sellers couldn’t push price back with volume, which confirms the hammer’s rejection was genuine.
Quick tips
Set an alert
Add the built-in “Hammer Retest” alert from the Alerts panel so you don’t have to watch the chart — TradingView will notify you the moment a retest is confirmed.
Timeframe matching
The HTF should be at least 3–5× your chart timeframe. On a 1m chart use 5m or 15m HTF. On a 5m chart, use 15m or 30m. Mismatched timeframes produce redundant confirmation.
PDL confluence
A STRONG signal near the previous day’s low is a high-confluence setup — the hammer rejected from a known support zone and came back to test it with less selling pressure.
How to Get this Indicator
Copy and Past this link in website and add to favor in trandingview
https://in.tradingview.com/script/RoZKcjgD-Hammer-Retest-Candle-with-Volume-Dashboard
Disclaimer – Scalping Indicator ( read before use )
This scalping indicator is developed strictly for educational and study purposes only. It is not a money-making machine, trading system, or guaranteed profit tool.
Markets are uncertain and no indicator can predict price movements with 100% accuracy. This tool should always be used along with your existing trading setup, proper analysis, risk management, and an overall market view. Do not rely solely on this indicator to make trading decisions.
This indicator does not offer any assurance of profit in the stock market. Past performance or signals generated by this tool do not guarantee future results.
All trading decisions are entirely your responsibility. You are solely responsible for any profits, losses, or risks you take while using this indicator. Always trade with proper knowledge, discipline, and risk control. Use this tool only as a supporting study aid, not as a standalone decision-making system.