In the world of stock trading, identifying promising opportunities quickly is crucial. A real-time Trading view screener provides traders with the tools necessary to filter through vast amounts of market data and pinpoint stocks that meet specific criteria. This Screener will guide you through understanding and utilizing the Trading view screener to enhance your trading strategy.
Overview & What This Indicator Does
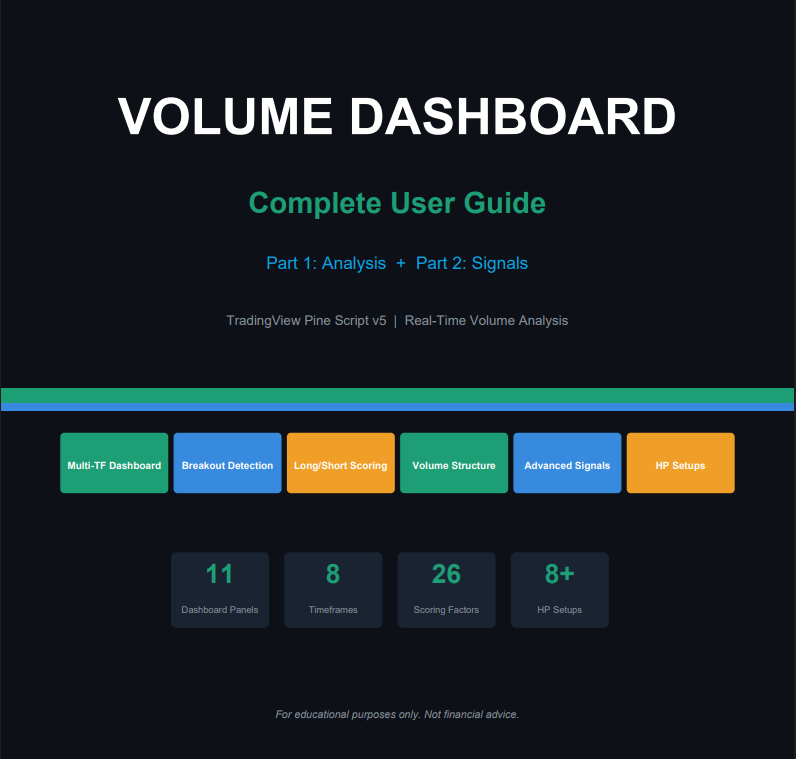
The Volume Dashboard is a two-part TradingView Pine Script indicator suite built for real-time volume analysis and high-probability trading decisions. Displayed directly on your chart, the dashboard offers 11 fully interactive panels that simplify volume-based insights and entry decisions.
📹 Volume Dashboard Part 2B — Animated Video Recorder
Parts & Panels
PART 1 — Analysis (5 Panels)
- Multi-Timeframe Dashboard (1m–1H)
- Half vs Half Volume Comparison
- Current Bar Panel (Live)
- Candle Volume History (up to 250)
- Volume Rank Scorecard
PART 2 — Signals (6 Panels)
- Reversal & Breakout Analysis
- Long / Short Final Conclusion
- Volume Structure Breakdown
- Vol vs Prev Body Analysis
- Final High-Probability Entry (26-pt)
- Bar coloring & chart labels with Advanced Volume Signals (Exhaustion, Delta)
Key Capabilities
- Real-Time Analysis: Every panel updates on the live (current) bar; signals refresh with each tick.
- Multi-Timeframe: Monitors 1m, 2m, 3m, 5m, 10m, 15m, 30m and 1H simultaneously from any chart timeframe.
- Scoring Engine: Two independent scoring systems: a 100-point timeframe (TF) score and a 26-point final entry score.
- Clear Entry Signals: LONG / SHORT / LEAN / NEUTRAL verdicts with a mandatory checklist and trigger levels.
- Risk Assessment: Detects climax exhaustion, wick rejection, volume divergence and two-bar reversal patterns.
- Advanced Pattern Detection: Identifies Buyer/Seller Exhaustion, Delta Divergence, Stop Hunts, Absorption and No Demand/Supply.
How to Use ?
QUICK START — Installation & Setup
Follow these exact steps to install both indicators on your TradingView chart:
Open TradingView & Select Your Chart
Choose an NSE/BSE symbol (e.g., NIFTY 50, BANKNIFTY). Set timeframe to 1m, 2m, 3m, or 5m.
- Add Indicator 1 — Volume Dashboard Part 1′
- Add Indicator 2 — ‘Volume Dashboard Part 2’
- Both indicators: Settings -> Dashboard -> Position = ‘Top Right’. Dashboard Size = ‘Large’.
Trading View -> Save layout. Both indicators will load automatically every session.
Volume Dashboard — Assets
6 Volume Signal Reference Cards
Volume Dashboard
Complete Guide
11 Panels • Multi-TF • Real-Time Signals
Unusual Volume + Breakout
Strongest bull signal
Score ≥19/26
All mandatory pass
Net bias ≥+5
Unusual vol detected
No breakout yet
Watch direction
Previous HV bar
did not break higher
Reversal risk
Product Disclaimer : This trading view real time scanner for stock and index is developed for study purposes only and should not be considered financial advice; always trade using your own analysis and risk management because no scanner or system can guarantee profits in any trading market, so treat this tool as an educational resource and a supplement to your personal research rather than a substitute for independent decision-making.